Graphics gd · imagick · svg · chart.js
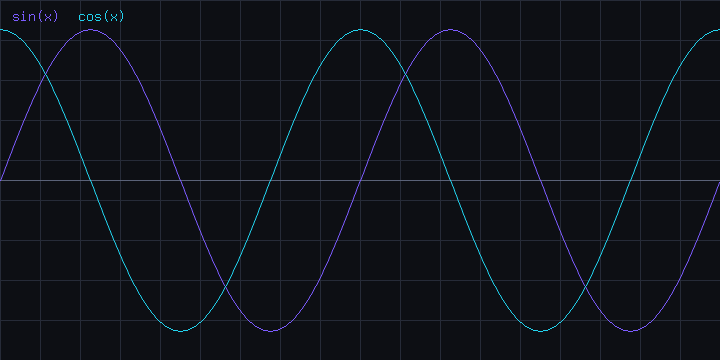
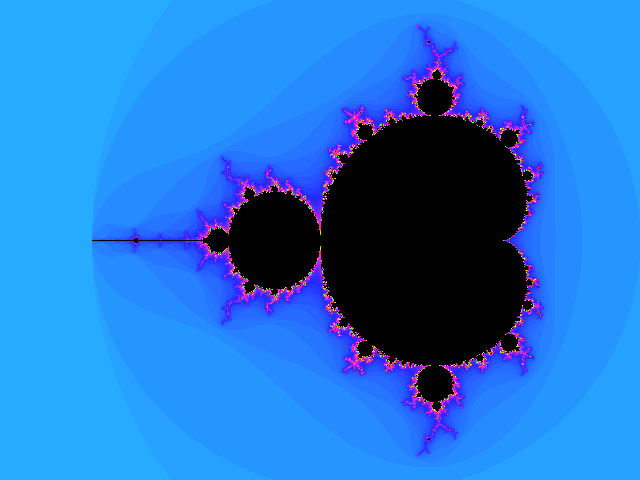
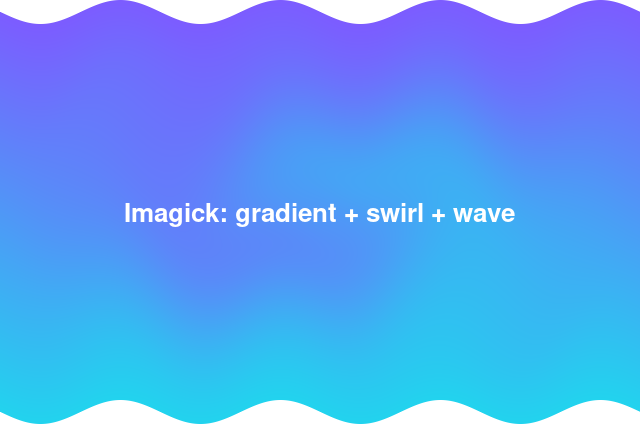
Four different ways to draw, four different engines — three of them pure server-side PHP.
Hand-built SVG zero dependencies
This bar chart is a string of SVG assembled by PHP from the dataset below — no image library, infinitely crisp.
graphics.php — view source, it's literally text.Chart.js php data → js render
The one place JS does the drawing — but the numbers come straight from PHP via json_encode().